Μετεωρολογικοί σταθμοί στην τάξη

Title: Sun, wind and rain: meteorology in the classroom
Author
Maria Birba, Theodoros Kondilis
Teaser
Why does it rain? Can we predict it? Give physics students a mass of weather data and some IT, and they can try working this out for themselves.
Text
Thermodynamics is taught in high-school physics – but how many students make the connection with our everyday weather, even though both are governed by the same variables (temperature, pressure and so on)? We decided to try to make this connection clear to students by asking them to explore for themselves how such variables affect each other in the environment, using real scientific data.
By the end, the students were impressed by the logical way in which these natural phenomena are related – and got a thrill from working with a top scientific institution the National Observatory of Athens.
Aims
Our aim was to extend the high-school study of thermodynamics to the Earth’s most important gaseous mixture: the atmosphere. So we devised an activity where students used real data from a weather station to investigate how temperature and pressure interact in the Earth’s atmosphere, and how these variables are correlated with other important physical quantities (relative humidity, dewpoint and wind direction).
In this article, we provide details of our activity and show our own results, as an example. We hope you will be inspired to repeat this activity using local data from your own region.
The activity itself takes about six hours, although you may need to allow up to an additional 4 hours to ensure that students have all the background knowledge they need before they start.
Preparation
Before starting the activity, students should have the following classroom knowledge and skills:
- Understanding of the gas laws and the variables involved
- Understanding of other thermodynamic variables (relative humidity, dewpoint) and theories of how they are related to temperature and pressure
- A basic understanding of meteorology (allow two hours to teach this, if needed). This should include: high and low pressure systems and the weather conditions they cause; air masses and fronts; global winds and jet streams; and how to read a weather map. Students should also be able to draw logical conclusions about everyday weather phenomena, such as ‘When the wind comes from the sea, the relative humidity increases’. (The resources section at the end of this article contains links to useful videos for teaching these topics.)
- Ability to plot graphs using computer programs. Microsoft Excel is ideal for this, as it is easy to extract data from tables and represent this graphically. Allow two hours to teach this if needed (this can be done in a science or IT lesson).
- For the data, you will need to find a suitable source. There are two options here: either contact a weather organisation that may be willing to provide data from a previous or current year (our source was the National Observatory of Athens); or install your own school meteorological station. Either way, you will need data for all the variables you wish to study. We suggest the following variables:
- Atmospheric pressure (Patm )
- Air temperature (θ)
- Relative humidity (RH)
- Dew point (DP)
- Wind direction
The amount of data you need will depend on what you wish to study. For example, if you wish to study changes in air temperature during one month, you will need 1–2 readings per day for 30 days. Alternatively, if you wish to study changes of air temperature from day to night, you will need readings taken every 30 minutes for a few days.
We used data from a winter period, because in the Mediterranean regions, winter is the most interesting season meteorologically, as it shows the greatest changes in the values of the physical variables we studied.
Procedure
- Divide the students into groups so that each group can work on a different set of data. Initially, we suggest that different groups work on the data for different variables in the same period, as shown in the graphs below. As an extension, data from different periods can also be used.
- Provide the students with their group’s data, and instruct each group to create one or more graph from this. They should plot the variables either against each other or against time (t), in each case for the whole period covered by the data.
- Ask students to decide what correlations they can find between the variables and express these as clearly as possible. Using their knowledge of meteorology, can they suggest what the causes might be for these correlations?
- As a final task, students can try to predict the weather in their own or another area, using current data and the principles they have learned about in the activity.
Results – some examples
To explain how to use the data, we show here some examples of the graphs produced in our classroom for December 2014, together with explanations of what they revealed.
The National Observatory of Athens provided us with data from a weather station between the Ionian Sea (part of the Mediterranean) on the southwest side of the station, and a mountain located in an easterly-southeasterly direction from the station. This was ideal, as it meant that wind blowing from different directions had a direct influence on the weather.
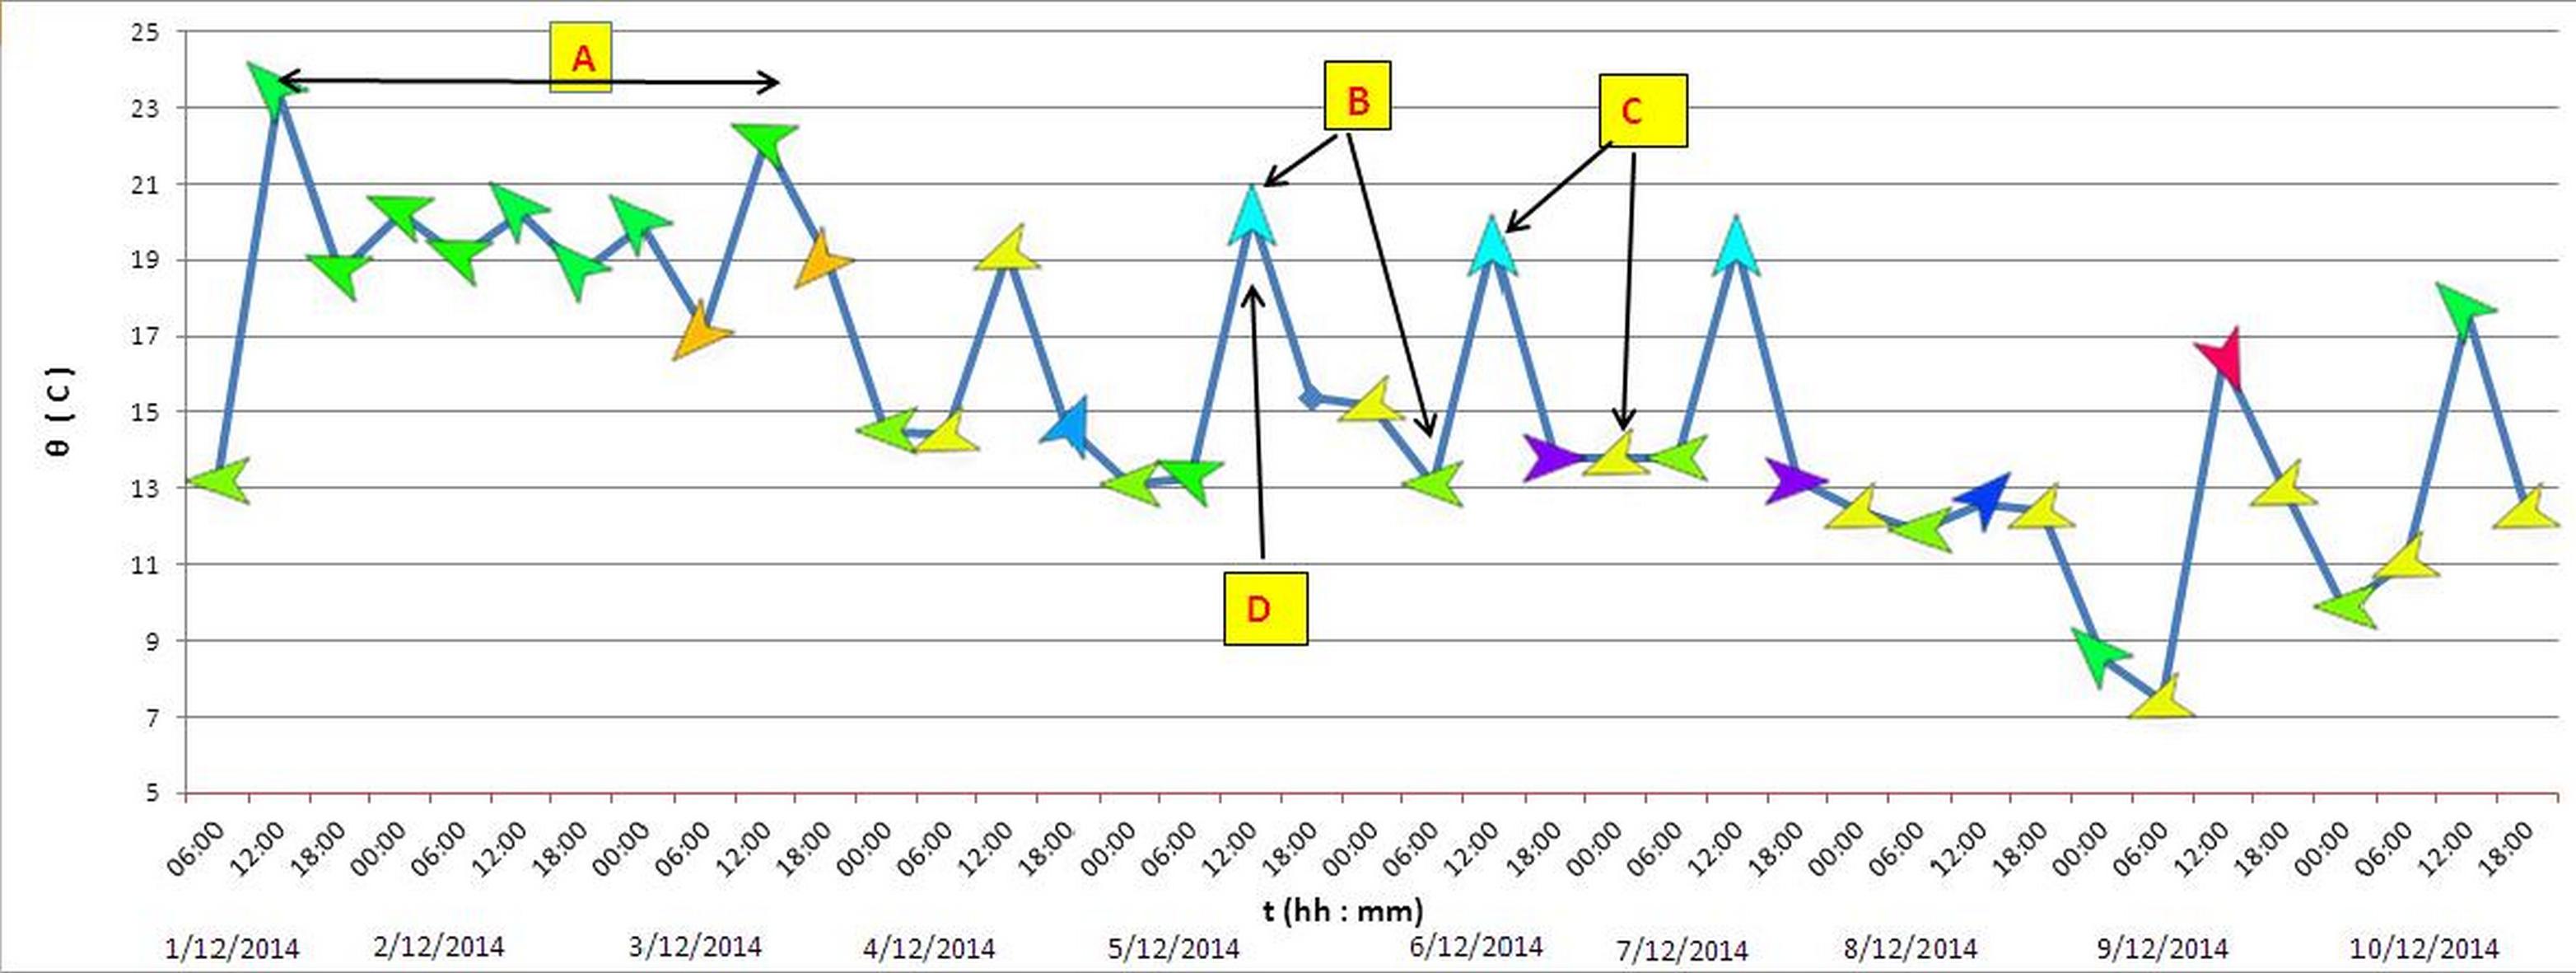
Figure 3: Wind direction and air temperature
From figure 3 we can see the following correlations:
- When southerly and easterly-southeasterly winds prevailed, there is an increase in air temperature. This is seen at the region of the graph labelled A. Such winds come largely from the direction of the mountain so they are naturally warm and dry. This is because air warms as it descends the mountain, and it is also dry having lost much of its moisture on the windward side of the mountain.
- The temperature fluctuates between night and day. It is cooler at night, warmer during the day. This can be seen at points B and C on the graph.
- Land and sea breezes: When there are humid winds during the day and dry winds during the night, it means daytime sea breezes (here from the west or southwest, as at point D) and evening land breezes (here from the east), which produces mild weather.
Another phenomenon, which is not apparent from the graphs but which we often notice, is that when there is a wind from the north, air temperature falls. This is because the northerly wind causes drop in air temperature as it comes from regions closer to the North Pole, which are therefore colder than ours.
Endnote
During the investigations, the students worked with great zeal as they got thoroughly involved in doing something rather unusual for a science lesson. The teachers encouraged students to make connections between their everyday experience and their existing scientific knowledge – so by increasing their understanding of common weather phenomena, they also extended and deepened their knowledge of thermodynamics.
Impressively, the students were able to use their new knowledge to make some valid short-term weather predictions. As a simple example, from noticing an increase in atmospheric pressure and temperature they predicted 1–2 days of fine weather without rain – quite correctly.
Σχολιάστε
Για να σχολιάσετε πρέπει να συνδεθείτε.